class: center, middle, inverse, title-slide # <span style='font-size: 60px'>Tired of Misattribution, Modeling Player Fatigue in the NBA </style> ### <span style='font-size: 35px'>Austin Stephen, Matthew Yep, and Grace Fain Advised by Maksim Horowitz </style> ### <span style='font-size: 35px'> 7/30/2021 </style> --- ### Why fatigue? -- <span> 1.</span> Fairness and strategic advantage <img src="./images/Motivation.PNG" alt="Not found" width="90%" /> ??? Media is full of things like this and it makes sense why. --- ### Why fatigue? <span> 1.</span> Fairness and strategic advantage <img src="./images/Map.png" alt="Not found" width="90%" /> ??? The literature is very clear that insufficient rest worsens athlete performance. Edwards et al The National Center for Biotechnology Information "Early identification and subsequent management of fatigue may prevent detrimental physical and physiological adaptations often associated with injury and enhance athletic performance and player availability" --- ### Project takeways <span style='font-size: 38px'> **1.** </span> Offer evidence players achieve a high degree of recovery between games. ??? Just list these -- <span style='font-size: 38px'> **2.** </span> Establish a subset of schedule induced factors that impact game outcomes. --- ### What is fatigue? - Cannot use direct measures ??? More concrete on fatigue: Edwards et al. The National Center for Biotechnology Information "the decline in objective performance measures derived from the capacity of the nervous system and contractile properties of muscles over time" In a perfect world we would directly measure an NBA players internal homeostasis either with hematological techniques or heart rate sensors. However, players cannot wear heart rate monitors or tracking equipment in games and we certainly don't have data about in/post-game blood samples for hematological analysis so we need a proxies to measure how fatigued a player was by in game events. -- - Identify events that fatigue players -- 1. **In-game events** - ex. Distance run or speed 2. **Between game events** - ex. Length of flight or rest since last game --- ### The in-game distance data - See appendix A for theoretical motivation <div id="rlgvecvdnf" style="overflow-x:auto;overflow-y:auto;width:auto;height:auto;"> <style>html { font-family: -apple-system, BlinkMacSystemFont, 'Segoe UI', Roboto, Oxygen, Ubuntu, Cantarell, 'Helvetica Neue', 'Fira Sans', 'Droid Sans', Arial, sans-serif; } #rlgvecvdnf .gt_table { display: table; border-collapse: collapse; margin-left: auto; margin-right: auto; color: #333333; font-size: 16px; font-weight: normal; font-style: normal; background-color: #FFFFFF; width: 80%; border-top-style: solid; border-top-width: 5px; border-top-color: #001747; border-right-style: solid; border-right-width: 5px; border-right-color: #001747; border-bottom-style: solid; border-bottom-width: 5px; border-bottom-color: #001747; border-left-style: solid; border-left-width: 5px; border-left-color: #001747; } #rlgvecvdnf .gt_heading { background-color: #FFFFFF; text-align: center; border-bottom-color: #FFFFFF; border-left-style: none; border-left-width: 1px; border-left-color: #D3D3D3; border-right-style: none; border-right-width: 1px; border-right-color: #D3D3D3; } #rlgvecvdnf .gt_title { color: #333333; font-size: 125%; font-weight: initial; padding-top: 4px; padding-bottom: 4px; border-bottom-color: #FFFFFF; border-bottom-width: 0; } #rlgvecvdnf .gt_subtitle { color: #333333; font-size: 85%; font-weight: initial; padding-top: 0; padding-bottom: 4px; border-top-color: #FFFFFF; border-top-width: 0; } #rlgvecvdnf .gt_bottom_border { border-bottom-style: solid; border-bottom-width: 2px; border-bottom-color: #D3D3D3; } #rlgvecvdnf .gt_col_headings { border-top-style: solid; border-top-width: 2px; border-top-color: #D3D3D3; border-bottom-style: solid; border-bottom-width: 2px; border-bottom-color: #D3D3D3; border-left-style: none; border-left-width: 1px; border-left-color: #D3D3D3; border-right-style: none; border-right-width: 1px; border-right-color: #D3D3D3; } #rlgvecvdnf .gt_col_heading { color: #333333; background-color: #FFFFFF; font-size: 100%; font-weight: normal; text-transform: inherit; border-left-style: none; border-left-width: 1px; border-left-color: #D3D3D3; border-right-style: none; border-right-width: 1px; border-right-color: #D3D3D3; vertical-align: bottom; padding-top: 5px; padding-bottom: 6px; padding-left: 5px; padding-right: 5px; overflow-x: hidden; } #rlgvecvdnf .gt_column_spanner_outer { color: #333333; background-color: #FFFFFF; font-size: 100%; font-weight: normal; text-transform: inherit; padding-top: 0; padding-bottom: 0; padding-left: 4px; padding-right: 4px; } #rlgvecvdnf .gt_column_spanner_outer:first-child { padding-left: 0; } #rlgvecvdnf .gt_column_spanner_outer:last-child { padding-right: 0; } #rlgvecvdnf .gt_column_spanner { border-bottom-style: solid; border-bottom-width: 2px; border-bottom-color: #D3D3D3; vertical-align: bottom; padding-top: 5px; padding-bottom: 6px; overflow-x: hidden; display: inline-block; width: 100%; } #rlgvecvdnf .gt_group_heading { padding: 8px; color: #333333; background-color: #FFFFFF; font-size: 100%; font-weight: initial; text-transform: inherit; border-top-style: solid; border-top-width: 2px; border-top-color: #D3D3D3; border-bottom-style: solid; border-bottom-width: 2px; border-bottom-color: #D3D3D3; border-left-style: none; border-left-width: 1px; border-left-color: #D3D3D3; border-right-style: none; border-right-width: 1px; border-right-color: #D3D3D3; vertical-align: middle; } #rlgvecvdnf .gt_empty_group_heading { padding: 0.5px; color: #333333; background-color: #FFFFFF; font-size: 100%; font-weight: initial; border-top-style: solid; border-top-width: 2px; border-top-color: #D3D3D3; border-bottom-style: solid; border-bottom-width: 2px; border-bottom-color: #D3D3D3; vertical-align: middle; } #rlgvecvdnf .gt_from_md > :first-child { margin-top: 0; } #rlgvecvdnf .gt_from_md > :last-child { margin-bottom: 0; } #rlgvecvdnf .gt_row { padding-top: 8px; padding-bottom: 8px; padding-left: 5px; padding-right: 5px; margin: 10px; border-top-style: solid; border-top-width: 1px; border-top-color: #D3D3D3; border-left-style: none; border-left-width: 1px; border-left-color: #D3D3D3; border-right-style: none; border-right-width: 1px; border-right-color: #D3D3D3; vertical-align: middle; overflow-x: hidden; } #rlgvecvdnf .gt_stub { color: #333333; background-color: #FFFFFF; font-size: 100%; font-weight: initial; text-transform: inherit; border-right-style: solid; border-right-width: 2px; border-right-color: #D3D3D3; padding-left: 12px; } #rlgvecvdnf .gt_summary_row { color: #333333; background-color: #FFFFFF; text-transform: inherit; padding-top: 8px; padding-bottom: 8px; padding-left: 5px; padding-right: 5px; } #rlgvecvdnf .gt_first_summary_row { padding-top: 8px; padding-bottom: 8px; padding-left: 5px; padding-right: 5px; border-top-style: solid; border-top-width: 2px; border-top-color: #D3D3D3; } #rlgvecvdnf .gt_grand_summary_row { color: #333333; background-color: #FFFFFF; text-transform: inherit; padding-top: 8px; padding-bottom: 8px; padding-left: 5px; padding-right: 5px; } #rlgvecvdnf .gt_first_grand_summary_row { padding-top: 8px; padding-bottom: 8px; padding-left: 5px; padding-right: 5px; border-top-style: double; border-top-width: 6px; border-top-color: #D3D3D3; } #rlgvecvdnf .gt_striped { background-color: rgba(128, 128, 128, 0.05); } #rlgvecvdnf .gt_table_body { border-top-style: solid; border-top-width: 2px; border-top-color: #D3D3D3; border-bottom-style: solid; border-bottom-width: 2px; border-bottom-color: #D3D3D3; } #rlgvecvdnf .gt_footnotes { color: #333333; background-color: #FFFFFF; border-bottom-style: none; border-bottom-width: 2px; border-bottom-color: #D3D3D3; border-left-style: none; border-left-width: 2px; border-left-color: #D3D3D3; border-right-style: none; border-right-width: 2px; border-right-color: #D3D3D3; } #rlgvecvdnf .gt_footnote { margin: 0px; font-size: 90%; padding: 4px; } #rlgvecvdnf .gt_sourcenotes { color: #333333; background-color: #FFFFFF; border-bottom-style: none; border-bottom-width: 2px; border-bottom-color: #D3D3D3; border-left-style: none; border-left-width: 2px; border-left-color: #D3D3D3; border-right-style: none; border-right-width: 2px; border-right-color: #D3D3D3; } #rlgvecvdnf .gt_sourcenote { font-size: 90%; padding: 4px; } #rlgvecvdnf .gt_left { text-align: left; } #rlgvecvdnf .gt_center { text-align: center; } #rlgvecvdnf .gt_right { text-align: right; font-variant-numeric: tabular-nums; } #rlgvecvdnf .gt_font_normal { font-weight: normal; } #rlgvecvdnf .gt_font_bold { font-weight: bold; } #rlgvecvdnf .gt_font_italic { font-style: italic; } #rlgvecvdnf .gt_super { font-size: 65%; } #rlgvecvdnf .gt_footnote_marks { font-style: italic; font-weight: normal; font-size: 65%; } </style> <table class="gt_table"> <thead class="gt_header"> <tr> <th colspan="9" class="gt_heading gt_title gt_font_normal gt_bottom_border" style><strong>Distance By Player Individual Games</strong></th> </tr> </thead> <thead class="gt_col_headings"> <tr> <th class="gt_col_heading gt_columns_bottom_border gt_left" rowspan="1" colspan="1">Name</th> <th class="gt_col_heading gt_columns_bottom_border gt_left" rowspan="1" colspan="1">Date</th> <th class="gt_col_heading gt_columns_bottom_border gt_right" rowspan="1" colspan="1">Min</th> <th class="gt_col_heading gt_columns_bottom_border gt_right" rowspan="1" colspan="1">Distance (mi)</th> <th class="gt_col_heading gt_columns_bottom_border gt_right" rowspan="1" colspan="1">Distance Offense</th> <th class="gt_col_heading gt_columns_bottom_border gt_right" rowspan="1" colspan="1">Distance Defense</th> <th class="gt_col_heading gt_columns_bottom_border gt_right" rowspan="1" colspan="1">Speed (mph)</th> <th class="gt_col_heading gt_columns_bottom_border gt_right" rowspan="1" colspan="1">Speed Offense</th> <th class="gt_col_heading gt_columns_bottom_border gt_right" rowspan="1" colspan="1">Speed Defense</th> </tr> </thead> <tbody class="gt_table_body"> <tr><td class="gt_row gt_left">Al Horford</td> <td class="gt_row gt_left">10/16/2018</td> <td class="gt_row gt_right">29.95</td> <td class="gt_row gt_right">2.15</td> <td class="gt_row gt_right">1.21</td> <td class="gt_row gt_right">0.94</td> <td class="gt_row gt_right">3.91</td> <td class="gt_row gt_right">4.15</td> <td class="gt_row gt_right">3.64</td></tr> <tr><td class="gt_row gt_left">Alex Abrines</td> <td class="gt_row gt_left">10/16/2018</td> <td class="gt_row gt_right">23.48</td> <td class="gt_row gt_right">1.88</td> <td class="gt_row gt_right">0.97</td> <td class="gt_row gt_right">0.91</td> <td class="gt_row gt_right">4.57</td> <td class="gt_row gt_right">4.96</td> <td class="gt_row gt_right">4.19</td></tr> <tr><td class="gt_row gt_left">Alfonzo McKinnie</td> <td class="gt_row gt_left">10/16/2018</td> <td class="gt_row gt_right">2.35</td> <td class="gt_row gt_right">0.18</td> <td class="gt_row gt_right">0.11</td> <td class="gt_row gt_right">0.07</td> <td class="gt_row gt_right">4.79</td> <td class="gt_row gt_right">4.99</td> <td class="gt_row gt_right">4.61</td></tr> <tr><td class="gt_row gt_left">Amir Johnson</td> <td class="gt_row gt_left">10/16/2018</td> <td class="gt_row gt_right">11.18</td> <td class="gt_row gt_right">0.87</td> <td class="gt_row gt_right">0.47</td> <td class="gt_row gt_right">0.39</td> <td class="gt_row gt_right">4.49</td> <td class="gt_row gt_right">4.83</td> <td class="gt_row gt_right">4.13</td></tr> </tbody> <tfoot class="gt_sourcenotes"> <tr> <td class="gt_sourcenote" colspan="9">Data courtesy of nba.com, Second Spectrum, Patrick Chodowski (NBAr)</td> </tr> </tfoot> </table> </div> ??? 3 important things: Gen by computer vision Game by game Player level --- ### In-game distance and performance - More distance does not correlate with better performance ??? Hypothesized more distance meant more effort so ideally better performance. Explain axis and data is 20k observations No correlation between fg percentage and distance a team travels. -- - p-value 0.402 <img src="presentation_10_min_files/figure-html/unnamed-chunk-2-1.png" style="display: block; margin: auto;" /> --- ### Post distance overload regress - Results consistent across 3, 5, 7 and 10 day windows <img src="presentation_10_min_files/figure-html/unnamed-chunk-3-1.png" style="display: block; margin: auto;" /> ??? Moving to the second part of our analysis of in-game distance we are looking to observe players fatiguing over time. We hypothesized a players who's workload deviated from their season average in previous days would exhibit a refractory period due to fatigue. However, we again found compelling evidence this is not the case. It actually appears the opposite is true, the greater workload in preceding days indicated in the observation game the athlete was likely to again take on a higher workload. Hypothesized this is caused by players who are playing well get left in the game longer. --- ### In-game distance back to back - Cannot draw conclusions across multiple seasons 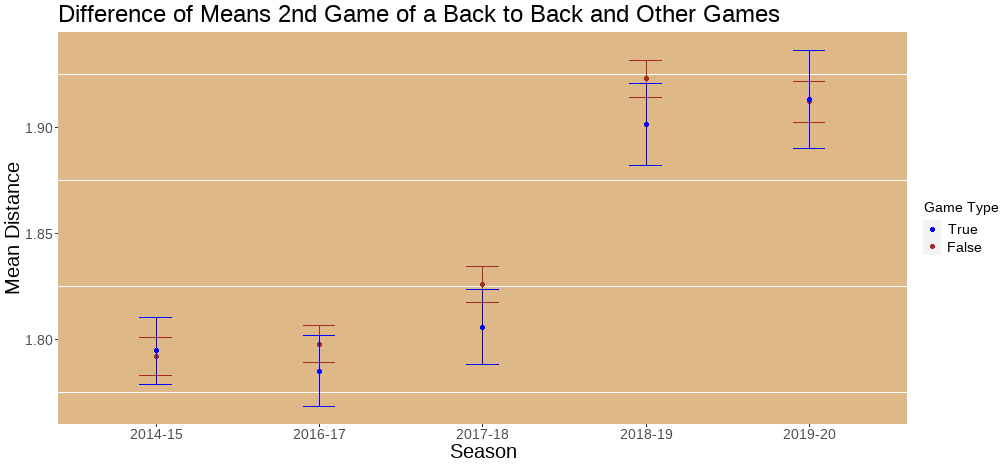<!-- --> --- ### Case study: load management <!-- --> --- ### What does this mean? - Basketball is complex - Evidence indicating players are recovered between games. - Intuition may be misguided ??? 1. Basketball is composed of complex interaction of skill sets and simply working harder does necessarily yield better results. While tracking data sounds exciting without being more closely tied to other in-game events it offers little utility by way of player performance. 2. One of the biggest trends in basketball commentary is players get tired from playing too many games and as a result the quality of game decreases. However, we offer compelling evidence a players workload over the their previous games does not influence their performance in future games. Based on these results, we wouldn't be surprised if often people are often searching to explain why a player did worse in a game when the truth is there may be nothing more than random variations in performance. Aka just because your star player had a bad night it does not mean fatigue was necessarily to blame. That said, we aren't trying to tell you players don't ever get tired because that's obviously not the case. Rather we are saying it appears the complexity of basketball and the techniques used by teams to ensure players are ready to play are more sophisticated than can be captured by measuring the players work. --- ### Timezones and circadian rhythm <!-- --> --- ### Taking a look at structural fatigue <div id="iaojdcjxyy" style="overflow-x:auto;overflow-y:auto;width:auto;height:auto;"> <style>html { font-family: -apple-system, BlinkMacSystemFont, 'Segoe UI', Roboto, Oxygen, Ubuntu, Cantarell, 'Helvetica Neue', 'Fira Sans', 'Droid Sans', Arial, sans-serif; } #iaojdcjxyy .gt_table { display: table; border-collapse: collapse; margin-left: auto; margin-right: auto; color: #333333; font-size: 16px; font-weight: normal; font-style: normal; background-color: #FFFFFF; width: 100%; border-top-style: solid; border-top-width: 5px; border-top-color: #666666; border-right-style: solid; border-right-width: 5px; border-right-color: #666666; border-bottom-style: solid; border-bottom-width: 5px; border-bottom-color: #666666; border-left-style: solid; border-left-width: 5px; border-left-color: #666666; } #iaojdcjxyy .gt_heading { background-color: #FFFFFF; text-align: center; border-bottom-color: #FFFFFF; border-left-style: none; border-left-width: 1px; border-left-color: #D3D3D3; border-right-style: none; border-right-width: 1px; border-right-color: #D3D3D3; } #iaojdcjxyy .gt_title { color: #333333; font-size: 125%; font-weight: initial; padding-top: 4px; padding-bottom: 4px; border-bottom-color: #FFFFFF; border-bottom-width: 0; } #iaojdcjxyy .gt_subtitle { color: #333333; font-size: 85%; font-weight: initial; padding-top: 0; padding-bottom: 4px; border-top-color: #FFFFFF; border-top-width: 0; } #iaojdcjxyy .gt_bottom_border { border-bottom-style: solid; border-bottom-width: 2px; border-bottom-color: #D3D3D3; } #iaojdcjxyy .gt_col_headings { border-top-style: solid; border-top-width: 2px; border-top-color: #D3D3D3; border-bottom-style: solid; border-bottom-width: 2px; border-bottom-color: #D3D3D3; border-left-style: none; border-left-width: 1px; border-left-color: #D3D3D3; border-right-style: none; border-right-width: 1px; border-right-color: #D3D3D3; } #iaojdcjxyy .gt_col_heading { color: #333333; background-color: #FFFFFF; font-size: 100%; font-weight: normal; text-transform: inherit; border-left-style: none; border-left-width: 1px; border-left-color: #D3D3D3; border-right-style: none; border-right-width: 1px; border-right-color: #D3D3D3; vertical-align: bottom; padding-top: 5px; padding-bottom: 6px; padding-left: 5px; padding-right: 5px; overflow-x: hidden; } #iaojdcjxyy .gt_column_spanner_outer { color: #333333; background-color: #FFFFFF; font-size: 100%; font-weight: normal; text-transform: inherit; padding-top: 0; padding-bottom: 0; padding-left: 4px; padding-right: 4px; } #iaojdcjxyy .gt_column_spanner_outer:first-child { padding-left: 0; } #iaojdcjxyy .gt_column_spanner_outer:last-child { padding-right: 0; } #iaojdcjxyy .gt_column_spanner { border-bottom-style: solid; border-bottom-width: 2px; border-bottom-color: #D3D3D3; vertical-align: bottom; padding-top: 5px; padding-bottom: 6px; overflow-x: hidden; display: inline-block; width: 100%; } #iaojdcjxyy .gt_group_heading { padding: 8px; color: #333333; background-color: #FFFFFF; font-size: 100%; font-weight: initial; text-transform: inherit; border-top-style: solid; border-top-width: 2px; border-top-color: #D3D3D3; border-bottom-style: solid; border-bottom-width: 2px; border-bottom-color: #D3D3D3; border-left-style: none; border-left-width: 1px; border-left-color: #D3D3D3; border-right-style: none; border-right-width: 1px; border-right-color: #D3D3D3; vertical-align: middle; } #iaojdcjxyy .gt_empty_group_heading { padding: 0.5px; color: #333333; background-color: #FFFFFF; font-size: 100%; font-weight: initial; border-top-style: solid; border-top-width: 2px; border-top-color: #D3D3D3; border-bottom-style: solid; border-bottom-width: 2px; border-bottom-color: #D3D3D3; vertical-align: middle; } #iaojdcjxyy .gt_from_md > :first-child { margin-top: 0; } #iaojdcjxyy .gt_from_md > :last-child { margin-bottom: 0; } #iaojdcjxyy .gt_row { padding-top: 8px; padding-bottom: 8px; padding-left: 5px; padding-right: 5px; margin: 10px; border-top-style: solid; border-top-width: 1px; border-top-color: #D3D3D3; border-left-style: none; border-left-width: 1px; border-left-color: #D3D3D3; border-right-style: none; border-right-width: 1px; border-right-color: #D3D3D3; vertical-align: middle; overflow-x: hidden; } #iaojdcjxyy .gt_stub { color: #333333; background-color: #FFFFFF; font-size: 100%; font-weight: initial; text-transform: inherit; border-right-style: solid; border-right-width: 2px; border-right-color: #D3D3D3; padding-left: 12px; } #iaojdcjxyy .gt_summary_row { color: #333333; background-color: #FFFFFF; text-transform: inherit; padding-top: 8px; padding-bottom: 8px; padding-left: 5px; padding-right: 5px; } #iaojdcjxyy .gt_first_summary_row { padding-top: 8px; padding-bottom: 8px; padding-left: 5px; padding-right: 5px; border-top-style: solid; border-top-width: 2px; border-top-color: #D3D3D3; } #iaojdcjxyy .gt_grand_summary_row { color: #333333; background-color: #FFFFFF; text-transform: inherit; padding-top: 8px; padding-bottom: 8px; padding-left: 5px; padding-right: 5px; } #iaojdcjxyy .gt_first_grand_summary_row { padding-top: 8px; padding-bottom: 8px; padding-left: 5px; padding-right: 5px; border-top-style: double; border-top-width: 6px; border-top-color: #D3D3D3; } #iaojdcjxyy .gt_striped { background-color: rgba(128, 128, 128, 0.05); } #iaojdcjxyy .gt_table_body { border-top-style: solid; border-top-width: 2px; border-top-color: #D3D3D3; border-bottom-style: solid; border-bottom-width: 2px; border-bottom-color: #D3D3D3; } #iaojdcjxyy .gt_footnotes { color: #333333; background-color: #FFFFFF; border-bottom-style: none; border-bottom-width: 2px; border-bottom-color: #D3D3D3; border-left-style: none; border-left-width: 2px; border-left-color: #D3D3D3; border-right-style: none; border-right-width: 2px; border-right-color: #D3D3D3; } #iaojdcjxyy .gt_footnote { margin: 0px; font-size: 90%; padding: 4px; } #iaojdcjxyy .gt_sourcenotes { color: #333333; background-color: #FFFFFF; border-bottom-style: none; border-bottom-width: 2px; border-bottom-color: #D3D3D3; border-left-style: none; border-left-width: 2px; border-left-color: #D3D3D3; border-right-style: none; border-right-width: 2px; border-right-color: #D3D3D3; } #iaojdcjxyy .gt_sourcenote { font-size: 90%; padding: 4px; } #iaojdcjxyy .gt_left { text-align: left; } #iaojdcjxyy .gt_center { text-align: center; } #iaojdcjxyy .gt_right { text-align: right; font-variant-numeric: tabular-nums; } #iaojdcjxyy .gt_font_normal { font-weight: normal; } #iaojdcjxyy .gt_font_bold { font-weight: bold; } #iaojdcjxyy .gt_font_italic { font-style: italic; } #iaojdcjxyy .gt_super { font-size: 65%; } #iaojdcjxyy .gt_footnote_marks { font-style: italic; font-weight: normal; font-size: 65%; } </style> <table class="gt_table"> <thead class="gt_header"> <tr> <th colspan="9" class="gt_heading gt_title gt_font_normal gt_bottom_border" style><strong>Travel, Schedule and Density Data</strong></th> </tr> </thead> <thead class="gt_col_headings"> <tr> <th class="gt_col_heading gt_columns_bottom_border gt_left" rowspan="1" colspan="1">date</th> <th class="gt_col_heading gt_columns_bottom_border gt_left" rowspan="1" colspan="1">visitor</th> <th class="gt_col_heading gt_columns_bottom_border gt_left" rowspan="1" colspan="1">opponent</th> <th class="gt_col_heading gt_columns_bottom_border gt_right" rowspan="1" colspan="1">game_net_rating</th> <th class="gt_col_heading gt_columns_bottom_border gt_right" rowspan="1" colspan="1">distance_diff</th> <th class="gt_col_heading gt_columns_bottom_border gt_right" rowspan="1" colspan="1">rest_diff</th> <th class="gt_col_heading gt_columns_bottom_border gt_right" rowspan="1" colspan="1">shift</th> <th class="gt_col_heading gt_columns_bottom_border gt_center" rowspan="1" colspan="1">b2b_2nd</th> <th class="gt_col_heading gt_columns_bottom_border gt_right" rowspan="1" colspan="1">net_rating_diff</th> </tr> </thead> <tbody class="gt_table_body"> <tr><td class="gt_row gt_left">2010-10-26</td> <td class="gt_row gt_left">Houston Rockets</td> <td class="gt_row gt_left">Los Angeles Lakers</td> <td class="gt_row gt_right">-0.9</td> <td class="gt_row gt_right">1380</td> <td class="gt_row gt_right">0</td> <td class="gt_row gt_right">-2</td> <td class="gt_row gt_center">TRUE</td> <td class="gt_row gt_right">-4.0</td></tr> <tr><td class="gt_row gt_left">2012-11-21</td> <td class="gt_row gt_left">Portland Trail Blazers</td> <td class="gt_row gt_left">Phoenix Suns</td> <td class="gt_row gt_right">-29.3</td> <td class="gt_row gt_right">1001</td> <td class="gt_row gt_right">-1</td> <td class="gt_row gt_right">1</td> <td class="gt_row gt_center">FALSE</td> <td class="gt_row gt_right">3.3</td></tr> <tr><td class="gt_row gt_left">2014-02-08</td> <td class="gt_row gt_left">Miami Heat</td> <td class="gt_row gt_left">Utah Jazz</td> <td class="gt_row gt_right">-5.8</td> <td class="gt_row gt_right">-421</td> <td class="gt_row gt_right">2</td> <td class="gt_row gt_right">1</td> <td class="gt_row gt_center">FALSE</td> <td class="gt_row gt_right">12.7</td></tr> <tr><td class="gt_row gt_left">2017-11-24</td> <td class="gt_row gt_left">New York Knicks</td> <td class="gt_row gt_left">Atlanta Hawks</td> <td class="gt_row gt_right">-12.2</td> <td class="gt_row gt_right">748</td> <td class="gt_row gt_right">0</td> <td class="gt_row gt_right">0</td> <td class="gt_row gt_center">TRUE</td> <td class="gt_row gt_right">2.3</td></tr> </tbody> <tfoot class="gt_sourcenotes"> <tr> <td class="gt_sourcenote" colspan="9">Data courtesy of Jose Fernandez (airball) and Patrick Chodowski (NBAr)</td> </tr> </tfoot> </table> </div> --- ### Composition of game outcome - Game outcome is the response - Event contributing to that outcome is a predictor - Most important factor is team strength - **Goal:** Extract relationships with the game outcome that are present once the team strength has been eliminated from the picture - See Appendices B and C for details on model construction ??? Outline the appraoch to modeling --- ### Linear model results #### Many of our travel and scheduling metrics had insignificant effects on game net rating... .pull-left[ * Distance traveled * Windowed distance traveled * Distance traveled difference * Flight duration * Timezone shift by -2, -1, 1, 2, and 3 hours ] .pull-right[ * 2nd leg of a back to back * Tipoff time + West coast teams playing in the morning EST + East coast teams playing at night PST ] --- ### Significant schedule induced factors <font size="5"> <i>gameNetRatingResiduals</i> = </font> <br> <font size="5"> `\(\beta_0\)` + `\(\beta_1\)`<i>restDiff</i> + `\(\beta_2\)` <i>3HrsBack</i> + `\(\beta_3\)`<i>3rdGame4Days</i> </font> <img src="presentation_10_min_files/figure-html/Linear Model-1.png" style="display: block; margin: auto;" /> --- ### Further work * Generalize load management to more players + Study effectiveness in the long run * Design a stronger proxy for team strength --- ### Relevance to stakeholders **NBA Teams:** - Allocation of resources - Load management **League Office:** - Schedule design - Viewership and profit maximization --- ## Thanks **Advisor:** Maksim Horowitz, Atlanta Hawks **Carnegie Mellon:** Ron Yurko Rebecca Nugent Beomjo Park Meg Ellingwood Nick Kissel **Special thanks:** Tom Bliss for your insight on fatigue in the NFL --- ### Appendix A #### Theoretical basis for distance's relationship with work W = F \* d, `\(\Delta\)`W = `\(\Delta\)`d <font size="4.5"> From kinematics work is defined as Force * distance. The force to move an object of constant mass is also a constant, therefore if we assume a players mass is constant over a season, the changes in distance for a game captures nearly all of their delta in work. In other words, work is agnostic to the time and cardinality of the force players use to move their bodies. This means despite being a very high level view of the game it is capturing a very high amount information about player exertion.</font> --- ### Appendix B #### Conceptual approaches to modeling team strength 1. __Constrained:__ Limited to the information available to a team when they would have played the game. 2. __Unconstrained:__ All available information about the team not incorporated into the response. <font size="4.5"> We chose to prioritize the second approach because it would allow us to decompose the response into its causes and we were interested in identifying what effect between game factors had on game outcome in the absence of as much of the team strength as possible. We felt understanding fatigue was more valuable that predicting fatigue. </font> --- ### Appendix C #### Investigation into modeling team strength <img src="presentation_10_min_files/figure-html/unnamed-chunk-4-1.png" style="display: block; margin: auto;" /> <font size="4.5"> The net rating of a game is composed of how the team preformed in that given game. If a team won a game with a rating of 10 their opponent had a rating of -10. The teams season average net rating difference served as the most simple and nearly the lowest RMSE. </font> --- ### Appendix C P2 <font size="4.5"> <b>w60_en</b> is a shrinkage method using elastic net trained on a large set of team information. <br> <b>w_40</b> is a window of the last 40 games a team has played as an additional predictor. <br> <b>w40_t</b> is a window of the last 40 games a team has played as an additional predictor with temporal weighting. <br> <b>w40_td</b> is a window of the last 40 games where an interaction with the games played and the season net rating difference allows. <br> <b>w60_tf</b> is a window of the last 30 games and 30 games into the future weighted separately from the season average. </font>